Jio Institute's Data Visualization Workshop for Reliance Retail
In a dynamic marketplace where data reigns supreme, Reliance Retail took a proactive step towards improving its workforce's capabilities through a specially curated 2-day Executive Education Program. Focused on the critical skill of Data Visualization, the workshop gathered 28 participants from diverse segments of Reliance Retail, including Reliance Retail Learning & Development Analytics, Grocery, Consumer Electronics, and Fashion & Lifestyle. The program deepened their understanding of data and its presentation.
The Faculties for this Program were Mr Jayen Thakkar of Super AI, a Silicon Valley, USA based company focused on AI and applications, and Mr Varun Tandon of Salesforce.com, one of the world’s top Companies focussing on enhancing customer relationships and collaboration. The Program commenced with Dr Nilay Yajnik of Jio Institute welcoming all the participants and highlighting the need for data visualization in the highly competitive retail environment.
Mr Jayen Thakker delivered an introductory session on Data Visualization, setting the stage for the entire course. Participants were introduced to the fundamentals, including the various data types and the concept of visual encoding. Visual encoding, essentially transforming data into graphical representations, was emphasized as a crucial aspect for effective communication through visuals.
Mr Varun Tandon explained the details of visual encoding, describing how to make visual structures using charts and images on a screen. Participants learned how our brains understand visuals, and they received helpful tips on choosing the right charts for various situations. He also discussed through several examples how various organizations in similar domains used the power of data visualization to enhance their competitiveness.
Building on this, Mr Thakkar shared strategies for creating impactful data visuals. He offered practical advice along with real-world examples to help attendees better understand. The session equipped participants with the skills to create powerful images that effectively communicate insights.
Shifting focus, Mr Thakkar continued guiding participants on the significance of colours and aesthetics in data visualization. He emphasized on the importance of dashboard design and storytelling, highlighting the need to present data in a compelling and easily understandable manner. Dashboard storytelling, as explained, involves creating clear and interactive visualizations on a single screen to communicate the complete story of key performance indicators, business strategies, and processes.
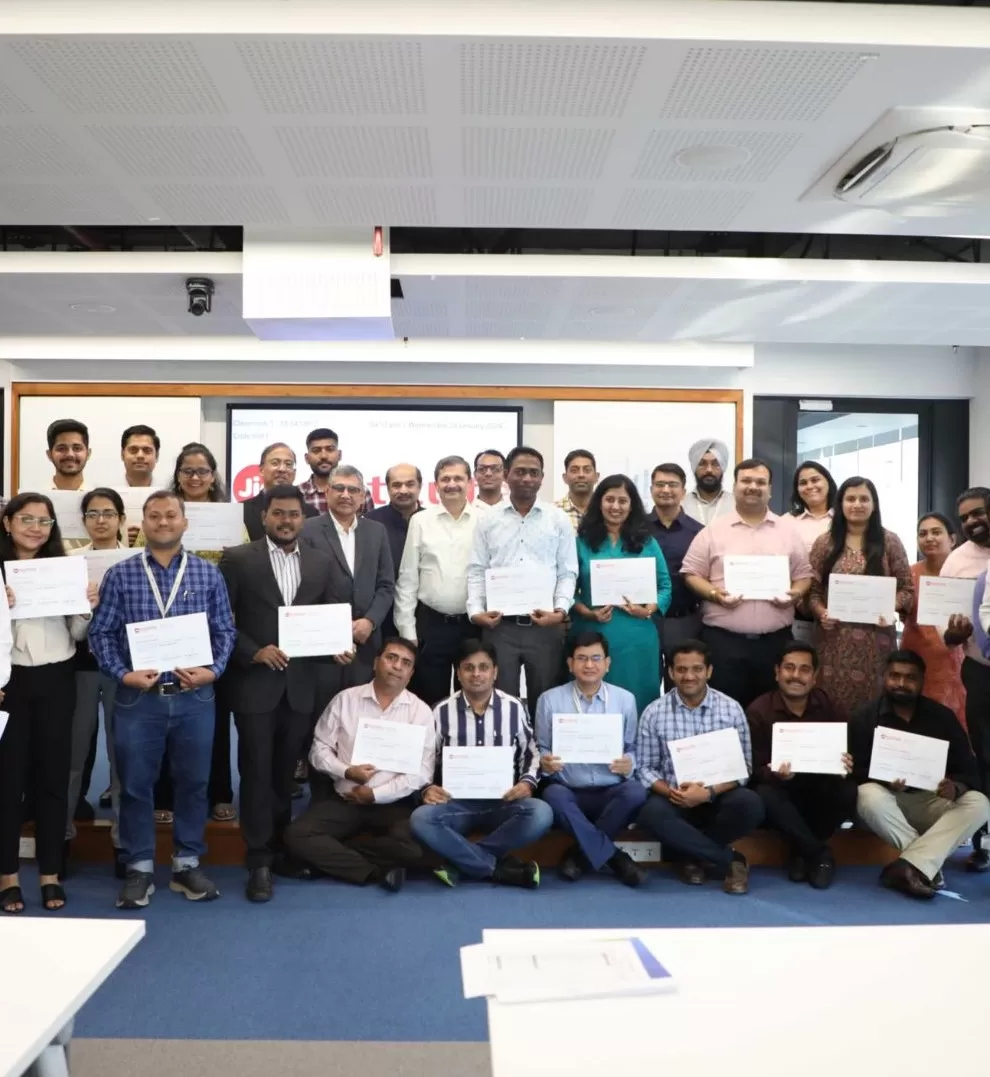
Adding a unique twist, participants were challenged to use colours and create presentations on paper. Participants then applied their newfound knowledge to real-world scenarios through group projects. This exercise required them to organize and present data systematically, similar to crafting structured presentations for data. Each group presented their project, engaging in interactive discussions, and received constructive feedback from Mr Thakker. The program concluded with the evaluation of group projects and a certificate valedictory.
During the program, participants also participated in team building activities through a cricket match. This provided them an opportunity to interact with their colleagues from across India and also to experience the beautiful Jio Institute Campus and the Institute’s world class facilities both in the classroom and outside the classroom.
The 2-day Executive Education Program on Data Visualization proved to be a transformative experience for the 28 participants from Reliance Retail. The diverse backgrounds of the participants brought a wealth of perspectives, enhancing the overall learning experience. The emphasis on practical application, coupled with collaborative projects and constructive feedback, made the program insightful and highly engaging. The participants left with enriched skills such in data presentation, organization, graph creation, and the effective use of colours in data representation and are ready to contribute effectively in their respective roles.