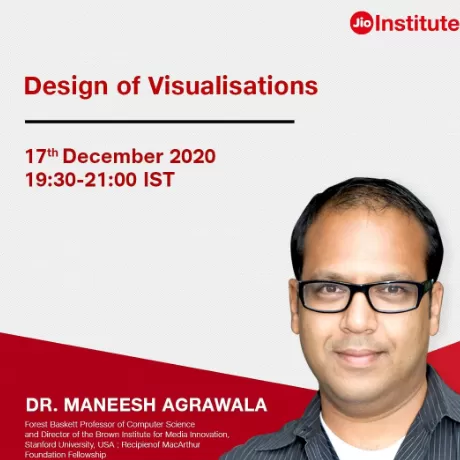
Design of Visualisations


Speakers
Introduction
Over the last 300 years, data visualisations have become the primary means for communicating quantitative information. They are prevalent in scientific papers, textbooks, economic reports, news articles and webpages.
Today, effective charts and graphs are widely available on the web, but machines cannot directly access it. The lack of machine readability significantly hinders analysis, reuse and indexing. A vast trove of information is locked inside these visualizations. In some cases, these visualizations are the only publicly available representation of the underlying data. Yet, while people can easily interpret data from charts and graphs, constructing effective visualizations is challenging. It requires understanding how to visually encode data so that viewers can easily perceive the underlying information.
As part of Jio Institute’s upcoming Masters in Artificial Intelligence and Data Science program, we would like to invite you to an interactive and informative masterclass on
Design of Visualisations by Dr. Maneesh Agrawala
In this session, Dr. Agrawala will describe how to construct effective visualisations that take advantage of human perception to depict data.
The session will also highlight recent tools and techniques that have been developed to algorithmically read visualizations and extract useful information from them. Dr. Agrawala will discuss how to use the extracted information to redesign ineffective visualisations. The session will also demonstrate how this approach allows individuals to add new forms of interactivity to static charts and graphs, and thereby bring such visualisations to life.
What Will You Learn?
- How to think about data visualisations as a set of encodings that map data values to visual attributes of graphical marks
- How the effectiveness of such encodings depends on data type and on human visual perception
- How one might recover such encodings from a bitmap of a visualisation.
- How such recovered structure might be used to add interactivity to static visualisations
- Much more..
Who Should Attend?
- Young Professionals
- Project Leaders and Managers
- Consultants and Educators
- Business Analysts
- Data Scientists/Researchers/Engineers
- Research and Development Professionals
- Entrepreneurs
- Sales and Marketing Leaders
- Engineers and Architects
- Design and Innovation Enthusiasts/Practitioner’s
- Anyone interested in learning about Data Visualisation.

