Data Visualization Workshop
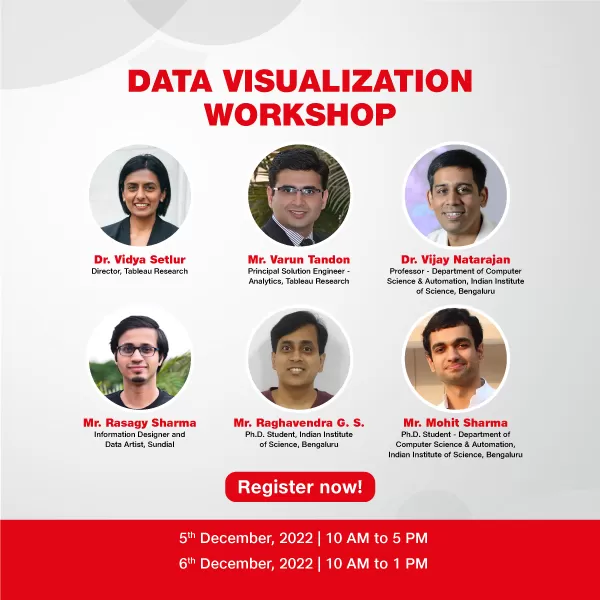
Speakers


Introduction
The field of data visualization goes beyond just displaying pretty charts; it's the process of helping people see, interact with, and better understand data. Whether simple or complex, the right visualization can bring everyone on the same page, regardless of their level of expertise. It’s hard to think of an industry that doesn’t benefit from making data more understandable.
As data is becoming ubiquitous to any business decision being made, visualization is an increasingly key tool to make sense of the trillions of rows of data generated every day. Data visualization helps tell stories by curating data into a form easier to understand, highlighting the trends and outliers, removing the noise from data, and highlighting useful information.
In this workshop, we will have several speakers discuss the state of the art in research and design in the field of data visualization. We will also introduce the audience to Tableau, provide a demo of its features, and a walkthrough of use cases where customers and businesses have benefitted from using Tableau in their own analytical workflows.
What Will You Learn?
Better understanding of the state of the art of data visualisation and its impact to real customers and users.
Who Should Attend ?
- IT Professionals
- Technology business leaders
- Entrepreneurs & Startup leaders
- Innovation Enthusiasts
- Technocrats
- Data Scientists/ Engineers
- Business Consultants
- Research and Development Professionals
- Marketing Professionals
- Project Managers
- Business Executives
Agenda
Welcome Day 1
Speakers

Opening and Talk: What makes intelligent visual analytics tools really intelligent?
Speakers
Q&A Day 1
Speakers
Spatiotemporal Data Analysis and Visualization: A Topological Feature-Directed Approach
Speakers

Break
What can design do with data?
Speakers

Lunch & Conversation
Tableau - Product, Use Cases, Demo
Speakers

Dashboard Heuristics Exercise
Speakers
Student Project Fast Forward Preview 10 mins
Speakers


Closing, Raffle giveaway of the book: Functional Aesthetics for Data Visualization
Speakers
Welcome Day 2
Speakers
Opening and Talk, What makes intelligent visual analytics tools really intelligent?
Speakers
Q&A Day 2
Speakers
Tableau Industry Talk and Case Studies
Speakers